Live Visualization
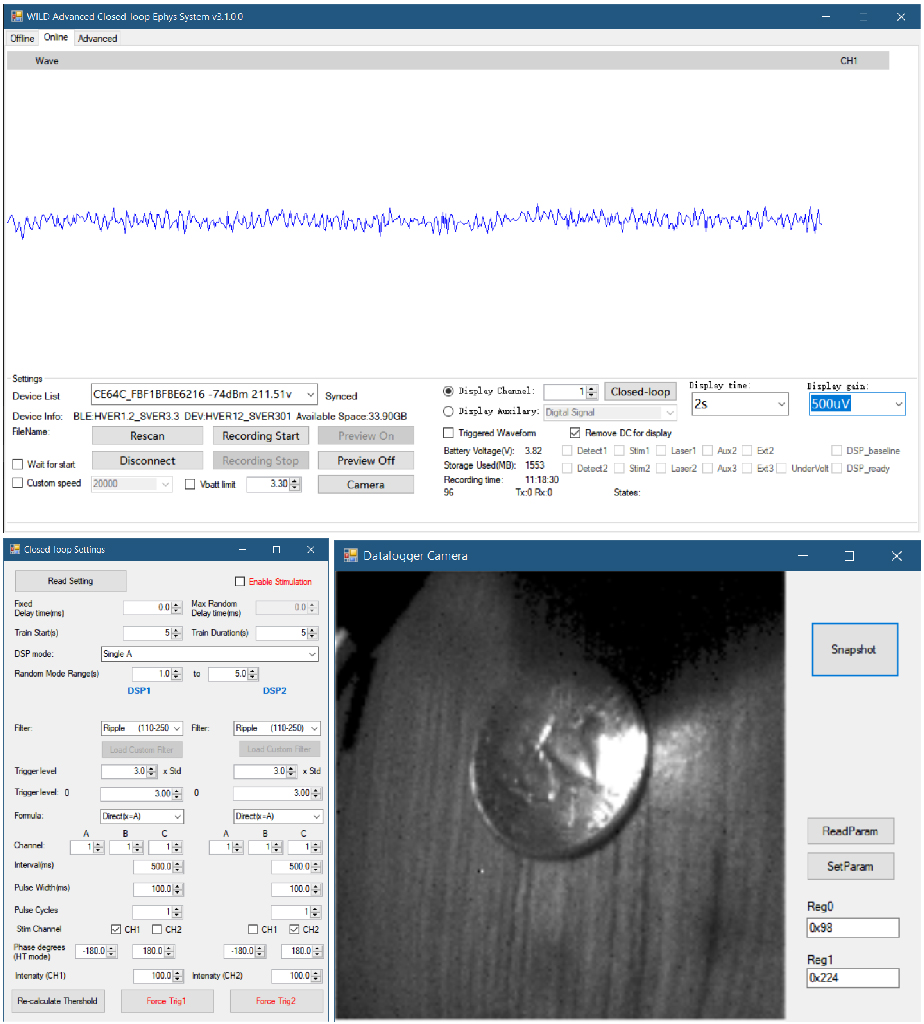
WILD Console includes real-time panels for checking selected neural channels, auxiliary signals, camera preview, closed-loop state, and device status during setup and recording.
Live visualization is a monitoring surface. Full-resolution neural, IMU, audio, camera, and event data are written locally to the device microSD card and recovered during export. Use the live view to confirm that the device is configured correctly, sensors are connected, and closed-loop state variables behave as expected.
What Live View Is For
Use live visualization to check:
- BLE connection state and TX/RX counters.
- Selected neural preview channels.
- Signal scale, saturation, obvious disconnects, and large motion artifacts.
- IMU and auxiliary-channel activity.
- Camera framing and gross focus during setup.
- DSP state, threshold crossings, stimulation state, and TinyML state messages when enabled.
- Recording state before handling the animal.
Display Controls
- Select neural preview channels.
- Select auxiliary signals from IMU and DSP outputs.
- Adjust display length.
- Adjust display gain.
- Show threshold overlays when closed-loop channels are selected.
- Monitor internal state, stimulation triggers, DSP state, and TinyML state messages.
Neural Preview
The neural preview is intended for fast quality checks, not for replacing exported electrophysiology data. Use it to confirm that the expected channels are active, that the signal is not saturated, and that preview gain and time scale are appropriate for the bench condition.
For recording sessions, treat exported amplifier.dat, event files, and metadata as the analysis source of truth. The live preview may be bandwidth-limited or channel-limited depending on configured mode and wireless conditions.
Auxiliary and Closed-Loop Monitoring
Auxiliary previews help confirm IMU activity, digital input edges, stimulation markers, and onboard DSP or TinyML states. During closed-loop tests, use the live display to verify that thresholds and state variables change in the expected direction before relying on the configuration in an animal session.
For timing-sensitive triggers, combine live monitoring with exported files and the synchronization procedures documented in Data Format. Live display timing is useful for operator feedback, but exported event timestamps and correction records are used for analysis.
Triggered CL Waveforms and Spectra (.169)
- Connect the logger and configure its filter/threshold in Closed-loop Settings.
- Open CL events, which replaces the old Triggered Waveform checkbox.
- Enable Capture live CL1 + CL2 to view received trigger events.
The upper two panels show the 256-sample CL1/CL2 waveforms. The lower panels show their PC-computed Gabor time-frequency displays. Waveform scales are independent and expressed in microvolts (0.195 uV/count). Each lane has a received-event counter and retains 20 waveforms; Clear removes the visible history without resetting those counters.
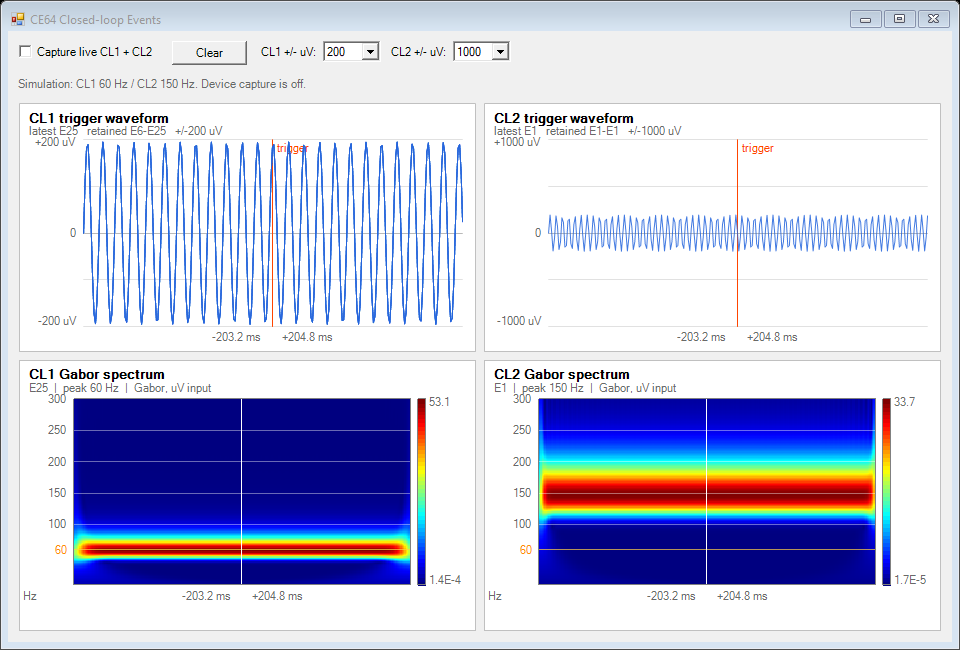
The screenshot uses simulated signals, not a live logger. Spectrum processing runs outside the UI thread, with one calculation and one newest pending event per lane. A spectrum can lag the waveform during bursts; its event label tells you which event it represents. Host event counts are not a guarantee that BLE delivered every device trigger.
PC-side zero padding makes the frequency grid denser but does not increase the physical frequency resolution of the short captured window. Build and offline 8/60/150 Hz tests passed; end-to-end current-device CL validation is pending. This release does not enable the separate continuous MCU spectrum mode and does not change the firmware or SD recording pathway.
Camera Preview
Camera preview is useful for checking field of view, lighting, gross focus, and cable stability before a session. Camera characterization, working distance, and sensor hardware are documented in Onboard Sensors.
Power and Bandwidth
Live preview consumes device power and BLE bandwidth. Disable preview when the experiment prioritizes maximum runtime over live monitoring, and recover the full dataset from microSD after the session.
Status Checks
- Confirm connection and TX/RX counters after BLE discovery.
- Confirm synchronization before starting a recording.
- Confirm recording state before handling the animal.
- Confirm export completion after removing the microSD card.
- Treat SD, BLE, low-battery, and release-image mismatch messages as session blockers until resolved.